Campaign Performance Measurement: The B2B GTM Guide
A campaign can produce strong clicks, conversions, and positive platform reports while destroying value. The reason is simple: observed activity isn't the same as incremental business impact. Recent coverage found that 80% of marketers don't fully understand why campaigns succeed or fail, while 63% rely on guesses such as sales spikes or click rates and 75% fall back on delivery metrics such as reach or CTR when results are difficult to explain. The reported survey findings point to a central challenge in campaign performance measurement. Teams don't lack data. They lack a reliable way to connect activity with causation.
Table of Contents
- Why Most Campaign Reporting Misses the Point
- Attribution Models and the Incrementality Gap
- Building a Unified Data Foundation
- KPI Frameworks by Funnel Stage
- Automating Scoring and Learning Loops
- Governance, Audits, and Quality Checks
Why Most Campaign Reporting Misses the Point
Campaign reporting often measures activity more accurately than business impact. High send volume, attractive open rates, and a healthy click rate can coexist with wasted spend, weak demand quality, customer churn, or conversions that would have occurred without the campaign. The operating problem is causal: observed performance receives credit, while true incrementality remains untested.
Start by defining return on investment, or ROI, before reviewing results. The standard formula is:
ROI = (sales or revenue minus marketing cost) divided by marketing cost, multiplied by 100
The formula is simple. The inputs are not. One report may use revenue, another gross profit, and a third pipeline. Each view can support a different decision, but they are not interchangeable. Investopedia's marketing ROI guidance explains the core profitability formula and why teams need a consistent definition.
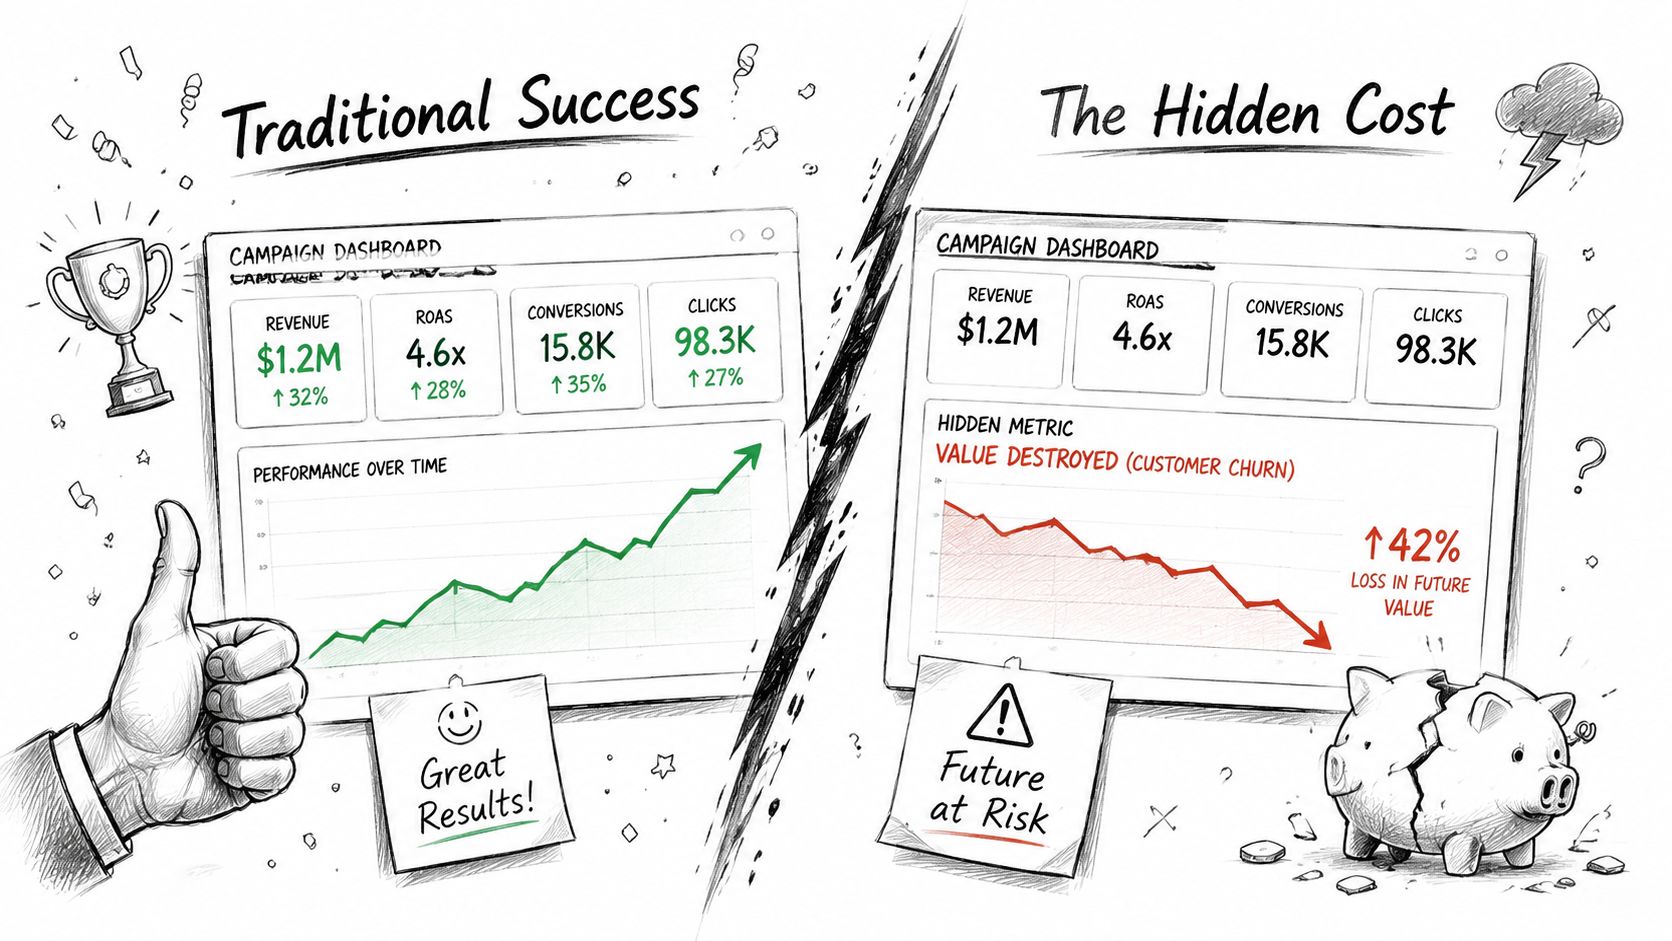
Revenue and profit answer different questions. Revenue indicates commercial traction. Profit tests whether the economics justify additional investment. A campaign can generate revenue and still fail once delivery cost, discounts, servicing costs, or churn are included. Every review therefore needs a stated metric definition, measurement window, and attribution rule.
A useful dashboard keeps operational and financial signals together:
- Delivery: sends, bounces, and unsubscribes.
- Engagement: opens, clicks, and click to open rate.
- Conversion: form completions, booked meetings, or purchases.
- Commercial outcome: revenue, cost, and the selected ROI definition.
Campaign history supplies the baseline that a single reporting period lacks. ActiveCampaign's campaign performance report demonstrates how reporting can combine sends, opens, clicks, unsubscribes, bounces, click to open rate, and revenue while retaining historical comparisons. A unified GTM engine can use those records to feed campaign results back into audience, offer, and channel decisions, then validate the resulting play rather than merely repeat the winning-looking activity.
A weekly spike means little without a baseline. A reporting stack that connects cost, conversion, revenue, and later customer outcomes gives operators a better basis for testing incrementality and deciding what to scale. Teams comparing sales reporting tools for 2026 should evaluate whether each system supports that feedback loop, not just whether it displays more charts.
Email teams should verify delivery before interpreting engagement. An inbox placement test helps separate a weak message from a deliverability problem.
Practical rule: Never approve a scale decision from an engagement metric alone. Require cost, conversion, commercial outcome, and a stated measurement definition in the same review.
Attribution Models and the Incrementality Gap
Attribution can describe a campaign's observed influence without proving that the campaign created the conversion. That causal gap is where reporting stacks produce confident but unreliable scale decisions.
First touch assigns credit to the earliest recorded interaction. It helps assess discovery channels, but it can overlook the work that moved a known prospect toward a decision. Last touch credits the final interaction, making the report easy to explain and useful for closing analysis. It can also overvalue branded search, direct visits, or a final email. Multi touch attribution distributes credit across the buyer path, yet it remains correlation based. It shows what a buyer did, not what would have happened if the campaign had not run.
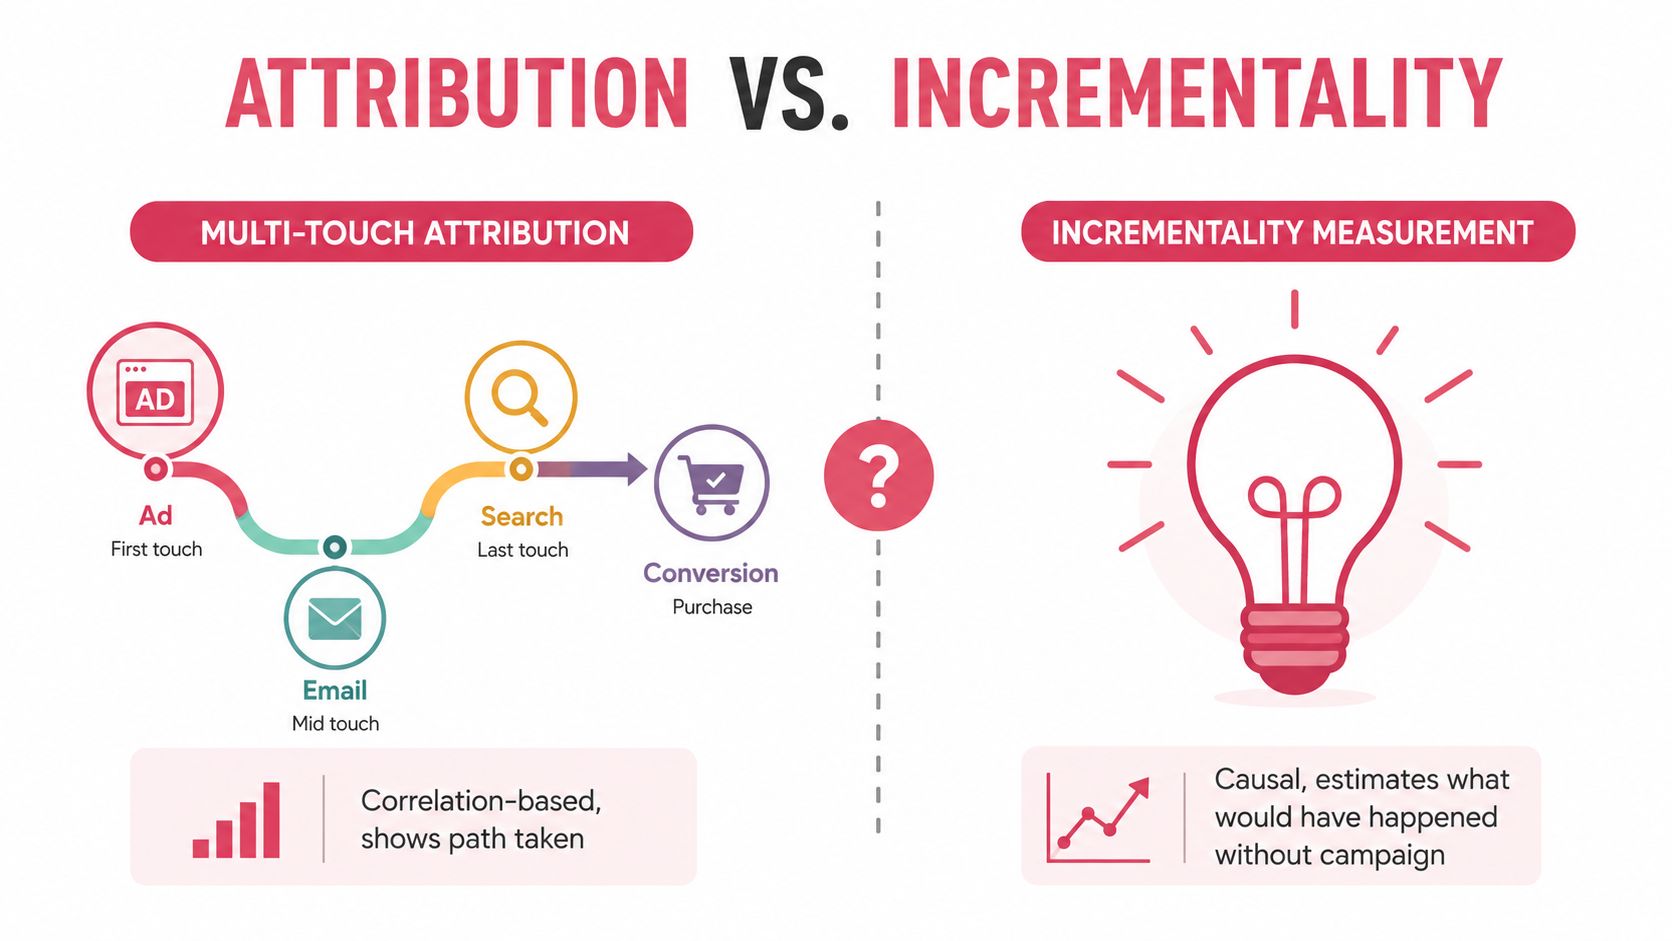
Attribution is useful, but it isn't proof
Multi touch models work well as directional diagnostics. They expose channel sequences, show common routes, and reveal tracking failures. Operators can use those signals to choose the next investigation, but the signals should not be treated as causal evidence.
The missing piece is the counterfactual. A prospect may convert after seeing an ad because the ad changed the outcome. The prospect may also have been ready to buy, received a referral, or encountered the brand through an untracked channel. The conversion record alone cannot separate those explanations.
Incrementality testing adds a control group. Google describes Conversion Lift as a causal method that compares people exposed to ads with a control group held back from seeing them, then measures the difference in conversions. Google's Conversion Lift documentation distinguishes incremental conversions from standard attribution reporting.
In a randomized design, the treatment group receives normal campaign targeting while the control group does not see the ads. The platform compares total conversions across both groups during the study period. Google's explanation of incrementality testing explains this treatment and control structure.
Use two layers of evidence
A practical measurement system uses attribution to diagnose the path and incrementality to validate whether the path caused additional demand.
- Diagnose the path. Use first touch, last touch, or multi touch reporting to identify where interactions occurred.
- Define the counterfactual. Set the control group criteria and specify how campaign exposure will be withheld.
- Measure lift. Compare conversion outcomes between treatment and control.
- Translate lift into economics. Google defines incremental ROAS as newly discovered incremental revenue divided by media spend. Google's measurement guidance connects causal lift to a budget efficiency decision.
- Make the decision. Scale when incremental economics support it, adjust when the result is unclear, and retire campaigns that capture existing demand without creating enough additional value.
A unified GTM engine can automate the feedback loop by connecting campaign exposure, holdout results, pipeline progression, and revenue outcomes. That turns an attribution signal into a validated play, then feeds the result back into audience, offer, and channel decisions. Teams working through the practical design can use this SaaS incrementality testing guide as a reference. The trade-off is operational complexity versus decision quality. Attribution is faster and continuously available. Holdout testing requires planning, but it provides evidence that an attribution model cannot.
Building a Unified Data Foundation
Campaign performance measurement breaks when every system tells a different version of the customer story. The CRM may show an opportunity, the outreach platform may show a reply, the enrichment provider may show a role change, and billing may show no revenue connection at all.
A unified foundation doesn't mean forcing every team into one application. It means establishing one consistent record of who was targeted, what happened, when it happened, and which commercial outcome followed.
Start with the event model
Before connecting tools, define the events that matter. A campaign record should identify the audience, segment, channel, message, owner, launch window, cost, and intended outcome. Each interaction should then map to a prospect, account, opportunity, or customer.
Use a stable identifier wherever possible. Without it, the same person can appear as a CRM lead, an enriched contact, a LinkedIn profile, and a billing contact with no reliable way to join the records.
A practical integration sequence looks like this:
- Connect the CRM. Treat it as the source for account status, opportunity stage, owner, and revenue fields.
- Connect outreach systems. Log sends, replies, bounces, meetings, and sequence status.
- Connect enrichment. Store firmographic and contact context with its source and retrieval time.
- Connect billing. Tie closed revenue, customer status, and account value back to campaign and opportunity records.
- Normalize events. Use consistent names for campaigns, channels, stages, and conversion states.
- Preserve raw data. Keep the original event alongside the normalized version so an analyst can audit transformations.
Keep orchestration replaceable
Tools such as Unipile, lemlist, and Crustdata can serve different parts of the motion. The operational risk appears when every provider change requires custom middleware, new field mappings, and another fragile export.
A unified GTM API reduces that overhead by giving tools one interface for execution and tracking. It also makes provider swaps less disruptive. The interface should log each touchpoint against the prospect and retain the conversation, not just a final status field.
That context includes the company's ICP, positioning, voice, and prior winning plays. A system that knows only that an email was sent can't judge whether the message fit the account. Guidance on what sales intelligence includes is useful here because enrichment becomes valuable only when it informs a decision.
Data quality needs its own check. Teams can use guidance on measuring completeness in data pipelines to identify missing fields, broken joins, and incomplete event coverage. The objective isn't perfect data. It's enough traceability to know which conclusions are trustworthy.
KPI Frameworks by Funnel Stage
A single campaign scorecard creates bad decisions because each funnel stage produces different evidence. Early stage metrics indicate whether the message reached the intended market. Middle stage metrics show whether interest became a meaningful action. Bottom stage metrics determine whether the economics support continued investment.
Top of funnel measures attention and audience fit
Reach and engagement can be useful at the start, but they aren't final success measures. The operator should ask whether the campaign reached the intended ICP, whether the audience interacted with the relevant message, and whether engagement came from accounts that could become customers.
Useful signals include:
- Reach: Did the campaign access the intended audience?
- Engagement rate: Did people interact with the content or message?
- Click quality: Did interactions come from relevant accounts?
- Unsubscribe and bounce behavior: Did execution damage list quality or delivery?
These metrics diagnose distribution and creative fit. They shouldn't carry the same decision weight as revenue.
Middle funnel shows intent and process friction
Conversion rate becomes more useful once the campaign asks for a defined action, such as completing a form or booking a meeting. Pair it with sales cycle length, because a high conversion rate that produces slow or poor quality opportunities may not improve the operating plan.
The review should connect campaign events to CRM stages. A marketing conversion isn't automatically a qualified opportunity. Sales acceptance, opportunity creation, progression, and disqualification provide the context needed to judge lead quality.
A leading indicator earns attention only when the team knows which later outcome it predicts.
Bottom funnel tests the business case
At the bottom of the funnel, use financial metrics. NetSuite defines customer acquisition cost, or CAC, as total sales and marketing costs divided by new customers acquired. It also defines the CLV to CAC ratio as customer lifetime value divided by customer acquisition cost. NetSuite's CAC and CLV guidance recommends reviewing CAC alongside conversion rates and sales cycle length.
A balanced scorecard should connect each stage to a decision:
| Funnel stage | Primary question | Useful decision |
|---|---|---|
| Awareness | Did the intended audience notice the campaign? | Adjust audience, message, or distribution |
| Consideration | Did engagement become qualified intent? | Improve conversion path or sales follow up |
| Revenue | Did acquired customers justify the cost? | Scale, revise, or retire the motion |
The weighting should follow the campaign objective. A brand campaign may need more time before revenue appears, while a demand capture campaign should face a tighter connection to qualified pipeline. In both cases, leading metrics warn of drift and lagging metrics decide whether the motion deserves more budget.
Automating Scoring and Learning Loops
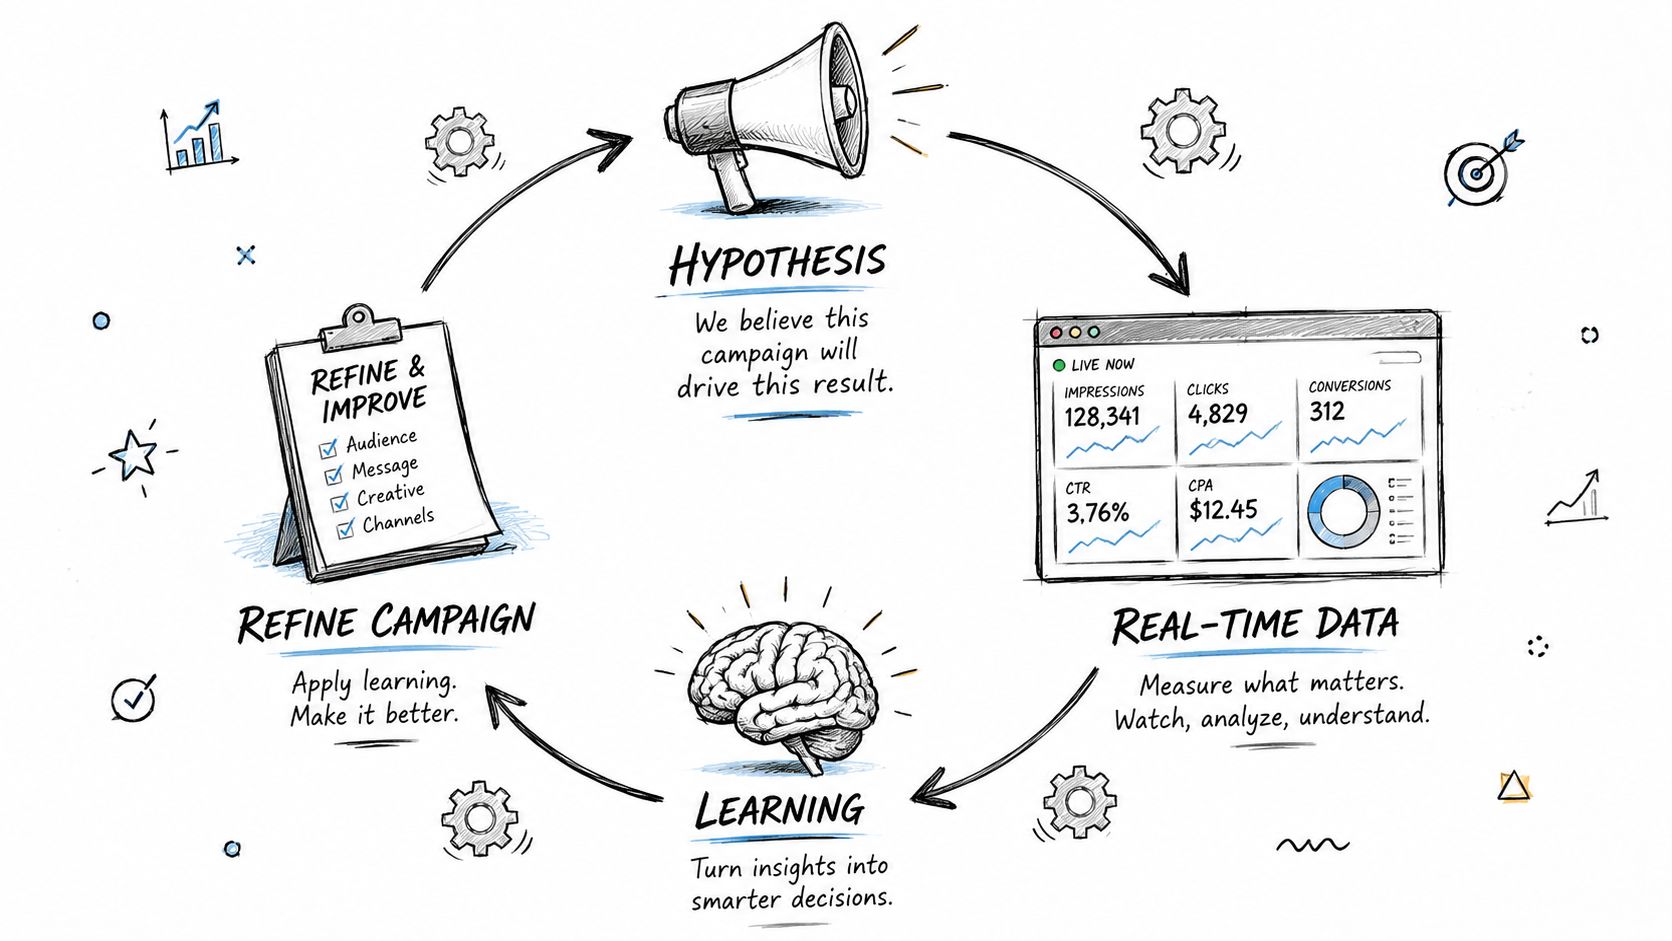
The most useful campaign system doesn't end with a report. It converts each campaign into a testable hypothesis, records the result, and changes the next play based on evidence.
Consider a B2B team testing a new outbound campaign. The hypothesis might be that a specific ICP segment will respond to a particular message through a selected channel. Before launch, the team defines the audience, execution rules, quality checks, and success metrics. The campaign then has something stronger than a target. It has a verdict standard.
Score the campaign as it runs
A unified GTM engine can collect campaign events from outreach, CRM, enrichment, and response systems. It can then compare actual behavior with the predefined criteria.
The workflow should look like this:
- Create the hypothesis. Record the audience, message, channel, and expected business outcome.
- Run the play. Execute prospecting, enrichment, personalization, outreach, and reply handling through connected tools.
- Capture telemetry. Log delivery, replies, meetings, qualification, opportunity movement, and revenue connections.
- Check for bias. Separate response quality from easy to reach segments, existing demand, or duplicated contacts.
- Issue a verdict. Mark the play as hypothesis, validated, or proven, or retire it when evidence is weak.
- Feed the result forward. Reuse winning conditions and change the failed variable in the next test.
Teams reviewing the mechanics of contact qualification can also use this guide to understand lead scoring. Scoring should support a decision, not become another dashboard that nobody acts on.
Replace spreadsheet memory with system memory
Manual reporting often leaves learning in a spreadsheet, a meeting note, or one operator's memory. That creates repeat failures. A team may relaunch a weak audience because nobody connected the previous result to the playbook.
Yalc can operate as one option for this workflow. It connects GTM tools through a unified interface, loads ICP and voice context, runs campaign playbooks, scores results against success metrics, records verdicts, and preserves the accumulated intelligence. Teams can compose plays through Claude Code with its MCP or run configured playbooks from Slack and its interface. Sensitive actions can remain subject to human approval.
The important design choice isn't automation for its own sake. It is automated feedback with explicit promotion and retirement rules. Winning patterns should become easier to reuse. Weak patterns should stop consuming budget. Human operators should still decide when a causal test is required and whether a result fits the company's broader strategy.
Governance, Audits, and Quality Checks
Automation increases the cost of a bad rule, so governance must exist before campaign volume grows. Every agent action should produce a step by step log that shows the input, decision, tool call, output, and resulting record change.
Sensitive actions need approval gates. Sending messages, changing CRM stages, exporting lists, and modifying campaign budgets shouldn't all receive the same level of autonomy. Scope permissions to the least access required for the task, and separate read access from write access wherever the workflow allows it.
Build an operational control layer
A reliable audit process includes:
- Action logs: Record what each agent did and which data it used.
- Approval checkpoints: Require a human decision for sensitive sends, edits, and budget changes.
- Permission scopes: Limit each play to the records and tools it needs.
- Data validation: Check required fields, duplicate contacts, timestamps, and campaign identifiers.
- Historical baselines: Preserve cohort and campaign history so new results can be compared with relevant prior performance.
- Exception alerts: Escalate missing events, unusual volume, broken integrations, or unexplained outcome changes.
Historical data should remain usable, not merely archived. Campaign reporting systems demonstrate the value of retaining campaign history and comparing metrics across time. Without those baselines, leaders can't distinguish a genuine shift from normal variation or a tracking failure.
The conversation itself can support the audit trail when the system preserves reasoning, approvals, and outcomes alongside execution events. That record helps operations leaders inspect why a campaign received its verdict and helps marketing and sales review the same evidence.
Quality check: If a leader can't reconstruct how a campaign decision was made, the system isn't ready for unsupervised scale.
Governance also protects learning. A flawed event join can promote the wrong play. An unreviewed message can damage trust. A missing control group can turn captured demand into a false claim of campaign impact. Strong controls keep automation fast without making its conclusions opaque.
Yalc connects campaign execution, CRM activity, enrichment, reporting, and GTM knowledge through one operating layer, with scoring, verdicts, audit logs, approvals, and reusable playbooks. Visit Yalc to see how a unified GTM engine can turn campaign performance measurement into a validated feedback loop instead of a retrospective spreadsheet.