8 Lead Generation KPIs That Matter in 2026

Most advice about lead generation KPIs still overweights lead volume. That creates a reporting problem and an operating problem. More names in the CRM can look like progress even when sales rejects most of them, follow up arrives too late, and pipeline never materializes.
Leaders need a connected measurement system instead of a dashboard full of unrelated counts. Cost shows efficiency. Qualification shows fit. Response time shows execution discipline. Attribution shows source quality. Opportunity and velocity metrics show whether lead activity is turning into future pipeline. A useful starting point is this set of essential metrics for pipeline growth, but value comes from how the metrics work together.
Benchmarks help, but they are directional. Definitions vary by company. Sales cycles vary by segment. Inbound and outbound produce different patterns. Qualification rules change as the market changes. That means every metric needs four things before anyone should trust it: a named owner, a fixed formula, a reporting cadence, and a decision threshold that triggers action.
A cheap lead is not efficient if sales rejects it.
The eight KPIs below matter because each one can answer a different management question. Is the channel economical. Is the lead a fit. Did the team respond fast enough. Which source deserves more budget. Are accepted leads becoming opportunities. Is pipeline momentum improving or stalling. Treated together, these lead generation KPIs form an operating rhythm, not a vanity report.
Table of Contents
- 1. Cost Per Lead (CPL)
- 2. Conversion Rate (Lead to MQL or SQL)
- 3. Lead Response Time
- 4. Lead Quality Score (LQS)
- 5. Lead Source Attribution
- 6. Sales Accepted Lead (SAL) Rate
- 7. Lead to Opportunity Rate
- 8. Lead Velocity Rate (LVR)
- 8-Point Lead Generation KPI Comparison
- Turn Eight KPIs Into One Operating Rhythm
1. Cost Per Lead (CPL)
CPL is still worth tracking, but only if the team stops treating it like a victory metric. It measures spend efficiency, not business value. The formula is simple: total lead generation spend divided by total leads created in the period.
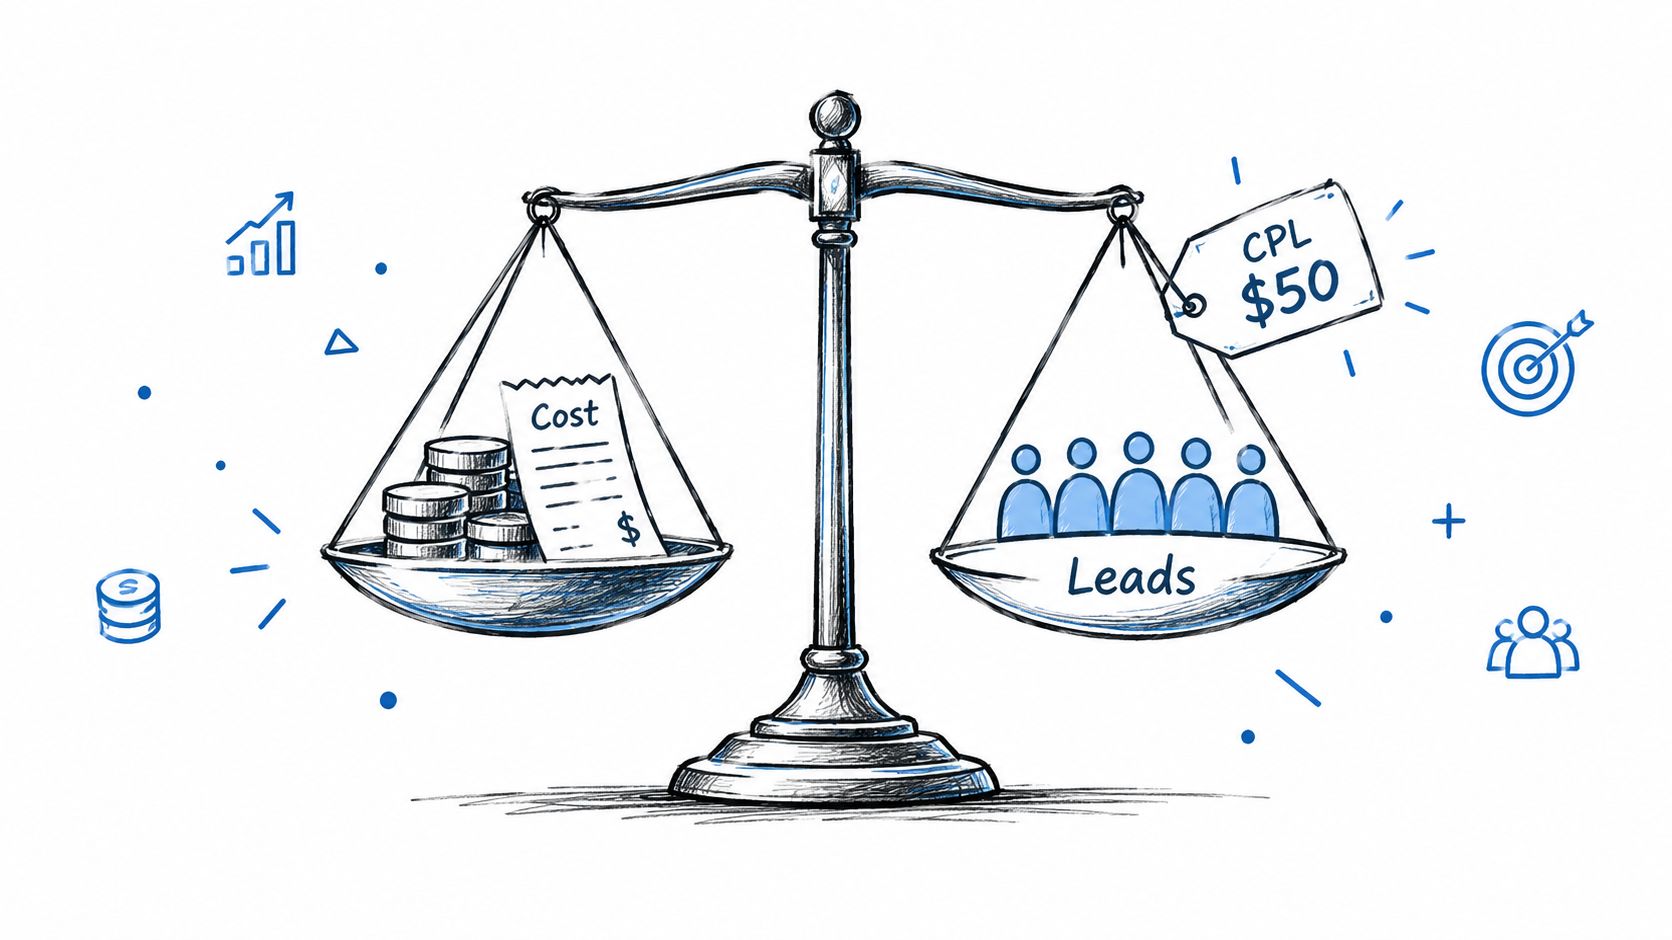
A good operator includes fully loaded costs. That means paid media, list sourcing, enrichment, sales engagement tools, CRM overhead, contractor support, and a reasonable estimate of operator time. Leaving those out makes one channel look cheap only because part of the cost is hiding in another budget line.
What CPL can prove and what it hides
CPL can prove whether a motion is getting more expensive over time. It can also prove whether one source is structurally more efficient than another. What it hides is lead quality. A low CPL can still be a bad outcome if downstream qualification collapses.
One benchmark set reported 2025 organic lead volume growth of 36.4 percent, SQL conversion rising from 5.2 percent to 9.2 percent, and CPL falling from $215 to $165. The important point isn't that lower CPL is always better. It's that efficient programs improved cost and quality at the same time.
Practical rule: Review CPL beside qualification and opportunity metrics. Never in isolation.
What to compare and how Yalc helps
Compare CPL by source, campaign, audience segment, geography, and motion type. LinkedIn outbound, paid search, events, partner leads, and website conversion should never sit in one blended number if the team expects to make budget decisions from it.
A SaaS team might find webinar CPL rising each month while outbound sequence CPL stays stable. That doesn't automatically mean webinars should be cut. It means the team should inspect whether webinar leads justify the premium later in the funnel.
Yalc can support this by logging campaign level inputs across channels, syncing lead creation into CRM state, and making it easier to compare playbooks against one cost framework. Teams running outbound lead generation programs can then retire expensive plays that never validate, instead of letting them coast on lead volume alone.
2. Conversion Rate (Lead to MQL or SQL)
A high lead count usually settles the wrong argument. Conversion rate tests whether those leads were worth collecting in the first place.
Use stage-specific definitions. Lead to MQL measures how often captured demand matches your fit and engagement thresholds. MQL to SQL measures whether those records survive sales review. The formula is simple: stage conversions divided by stage entrants for the same period, source, and rule set. If the denominator shifts because definitions changed mid-quarter, the trend stops being diagnostic.
What this KPI can prove, and what it can hide
Conversion rate can prove whether targeting, offer design, and qualification logic are aligned. A strong lead to MQL rate suggests the top of funnel is attracting the right people or screening out the wrong ones. A strong MQL to SQL rate suggests sales agrees that the handoff is worth time.
It can also hide failure downstream. A team can post healthy MQL to SQL conversion while creating little pipeline if accepted leads stall, meetings no-show, or opportunities fail to open. It can hide loose standards too. If MQL volume drops and conversion rises after the team tightens definitions, the rate improved, but total pipeline may still fall.
The metric needs context. Read it beside SAL rate and lead to opportunity rate, not as a standalone win.
How to read the funnel without flattening it
Analysts at First Page Sage reported average B2B landing page conversion rates by industry, with software companies averaging 3.8 percent and business services averaging 7.0 percent in their review of B2B landing page conversion rate benchmarks. The useful takeaway is not the exact benchmark. It is the gap between sectors and motions. A blended benchmark can make a weak offer look normal, or make a niche campaign look broken when it is aimed at a narrower buyer set.
That is why comparisons matter more than headline rates.
Segments to compare
Compare conversion rates by source, persona, company size, offer type, geography, and inbound versus outbound motion. Add first-touch campaign and rep owner if handoff quality varies by team.
A common pattern is website demo requests converting to MQL at a high rate while event scans lag badly. That does not automatically mean events underperform. It may mean the capture method is too broad for direct routing, or that event leads need different qualification rules and slower nurture before sales contact.
Compare at least three cuts before changing budget:
- Source versus source
- Persona versus persona
- High-fit accounts versus all other accounts
Those comparisons show whether the issue is audience selection, conversion path, or stage definition.
Practical Yalc workflow
Yalc can score incoming leads against the active ICP, write that score back to CRM, and track stage changes by source and play. That lets operators catch a specific failure mode early. For example, if paid search leads convert to MQL but not to SQL, the intervention is usually tighter form routing, stricter qualification thresholds, or a revised offer. If outbound leads reach SQL at a higher rate but in lower volume, the decision may be to protect that motion for priority segments rather than force scale.
Used this way, conversion rate becomes an operating metric. It helps teams decide where to tighten criteria, where to change routing, and where more lead volume would only amplify waste.
3. Lead Response Time
Lead response time is one of the clearest execution KPIs because the formula leaves little room for interpretation. Measure the elapsed time from a lead conversion event to first rep outreach, or to the first qualifying sales contact if that is the company's chosen definition.
That sounds operationally narrow. It isn't. Slow response changes the economics of demand capture because buyer intent decays while teams wait to assign, enrich, or approve the lead.

Speed is a qualification variable
One benchmark summary reports that companies responding within five minutes are 21 times more likely to qualify the lead than companies waiting 30 minutes. That makes response time more than a service metric. It is a qualification metric.
Another source defines lead response time directly as the time from conversion to first outreach, which gives teams a clean operational definition to enforce in systems and service levels through this explanation of lead generation KPIs and metrics.
Fast response matters most when buyer intent is fresh and routing is clear.
What it can hide and how to act
Response time can prove whether routing, ownership, and alerting are functioning. It can hide message quality. A fast irrelevant email is still bad outreach. The fix is to pair speed targets with templates, personalization rules, and clear ownership by source.
Compare response time by source and by team. Demo requests, hand raisers, webinar follow ups, cold replies, and anonymous visitor identification should not share one service level. They represent different buying signals and deserve different timing rules.
Yalc can help by triggering outreach workflows when a lead meets criteria, assigning the play based on source and fit, and logging whether the team met service levels. Teams trying to qualify leads faster can use that data to see whether the problem is speed, routing, or qualification copy.
4. Lead Quality Score (LQS)
A lead quality score gives the team a way to prioritize before the funnel has fully played out. That makes it useful, but also dangerous. If the score isn't tied to real outcomes, it becomes a prettier version of gut feel.
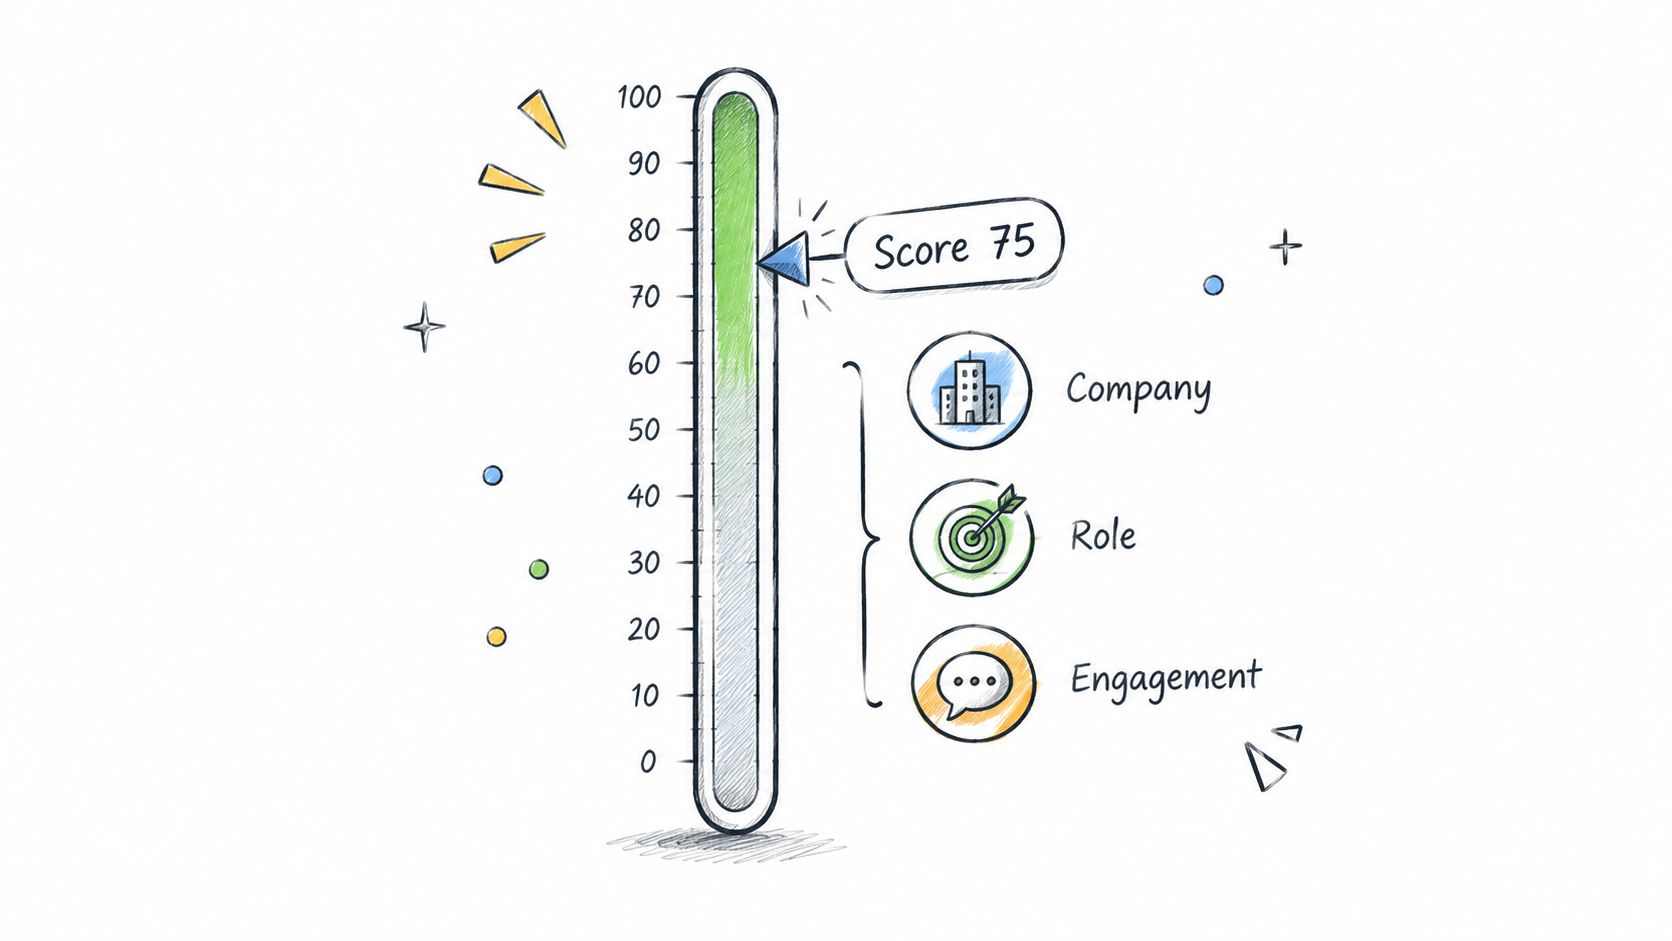
The formula depends on the company. Teams combine firmographic fit, role relevance, account context, and engagement signals into one weighted score. The score can be numeric or tiered, but the logic should be transparent enough that sales can challenge it.
Why quality scoring matters more than another volume target
Recent guidance on lead generation metrics argues that operators should focus less on raw lead counts and more on outcome linked metrics such as MQL to SQL, SQL to opportunity, pipeline velocity, and reply quality in this analysis of lead generation metrics. A quality score is useful because it helps teams act on that advice before the lead has progressed deep enough to produce those downstream signals.
This KPI can prove whether the team is getting closer to the ICP over time. It can hide whether the model is overweighting signals that correlate with activity rather than purchase intent.
A better scoring workflow
The best comparisons are not just average score by source. Compare score bands against later outcomes. Did high score leads get accepted by sales. Did they create opportunities. Did they move stages faster. Without that validation loop, the score is only a sorting device.
A practical pattern is simple:
- Define score inputs: Use company fit, role seniority, account relevance, buying signals, and recent engagement.
- Validate score bands: Check whether the top band consistently produces stronger sales acceptance and opportunity creation.
- Adjust weightings: Remove inputs that create busy looking leads with weak pipeline outcomes.
Yalc fits here by letting teams operationalize an ICP driven scoring model, version the logic as the market changes, and route actions based on thresholds. The point isn't to automate judgment away. It's to make judgment testable. A team evaluating what lead scoring is and how it works should expect the score to earn trust through outcomes, not through complexity.
5. Lead Source Attribution
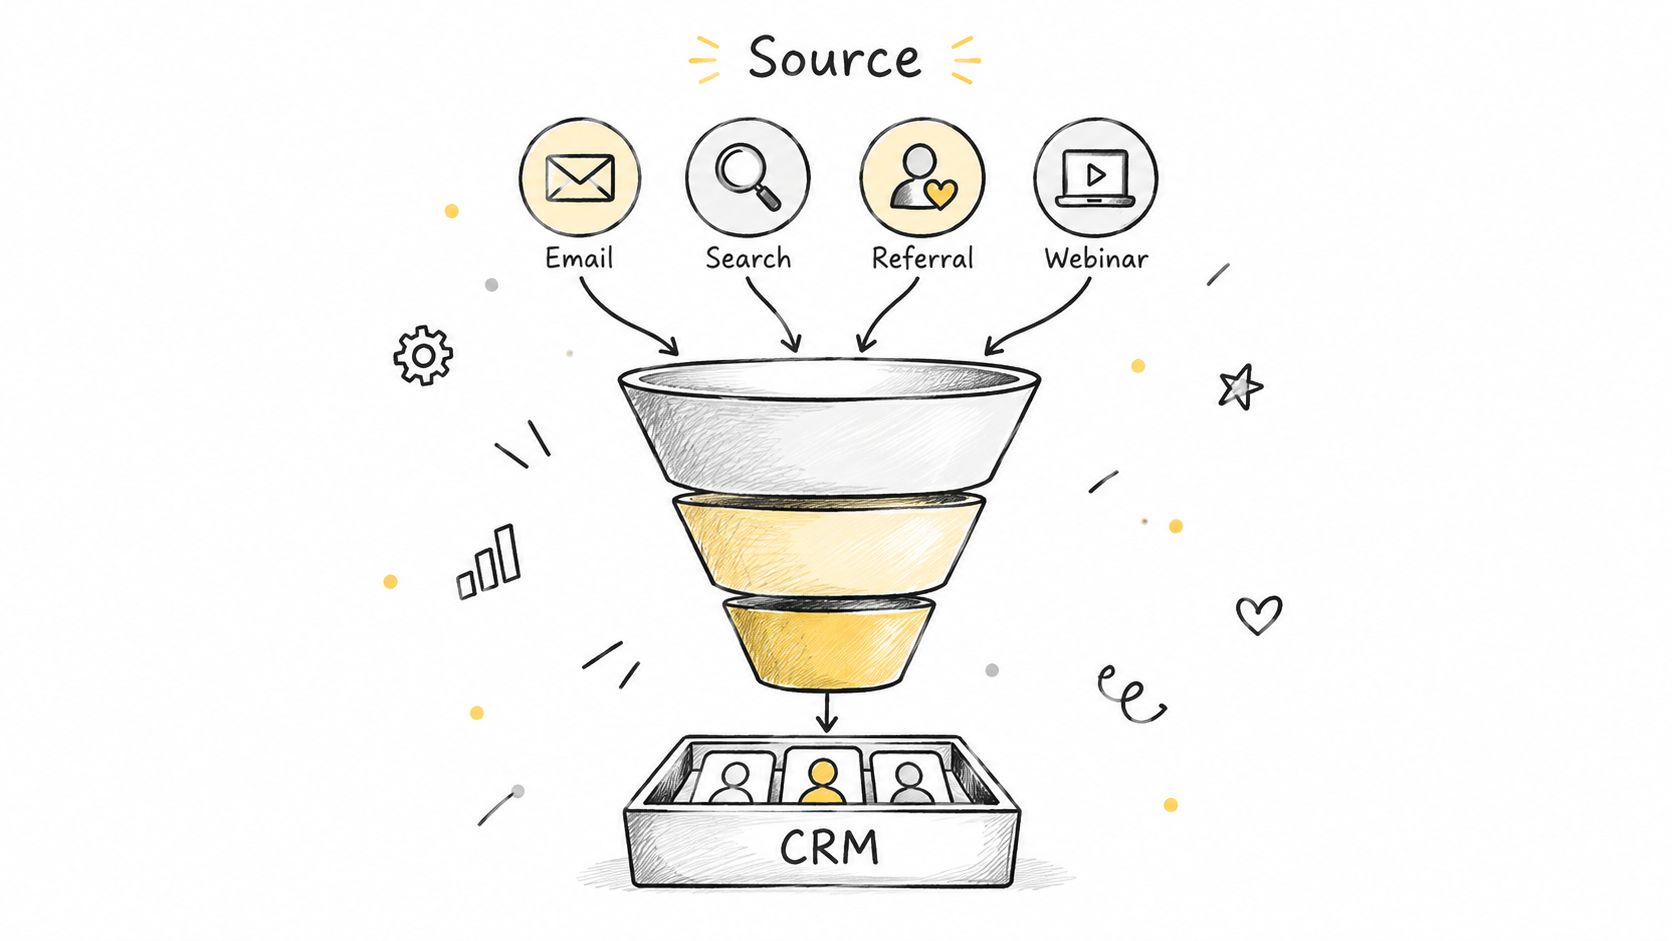
Attribution is less about credit and more about source quality control. If a team can't say where accepted leads and opportunities originated, it cannot reallocate budget with confidence. That makes attribution one of the few KPIs that directly affects both finance and frontline execution.
The formula depends on the model. First touch, last touch, and multi touch each answer different questions. The problem is not choosing the wrong model. The problem is changing models so often that trend lines become unusable.
What attribution can prove
Attribution can prove which channels consistently originate qualified activity. It can also reveal whether a low volume source is producing outsize downstream value. One common example is referrals or partner sourced leads. They may look small at the top of the funnel but carry disproportionate value later.
Newer KPI guidance also points to buying group and account based measurement gaps, including engaged buying group size, meetings booked per targeted account, partner sourced pipeline, and stage progression velocity in this review of B2B lead generation strategies. That matters because one "lead source" often influences several contacts inside one account, not just one record.
Attribution should follow the account journey, not just the first form fill.
Segments and Yalc workflows
Compare attribution by source, campaign, audience, account tier, and motion. Website visitor identification, outbound email, LinkedIn engagement, webinars, referrals, and partner channels often produce very different downstream patterns. Teams should also compare first touch against later touches to understand whether one source introduces demand while another converts it.
A realistic scenario is a growth team finding that one source creates many leads but few sales accepted ones, while another creates fewer leads but stronger account engagement. That doesn't mean the first source has no value. It means the team may be using it for awareness while expecting it to behave like a conversion source.
Yalc can help unify source capture across tools, preserve source data at the moment of record creation, and compare source performance against the same downstream stages. That is often enough to turn attribution from a debate into an operating input.
For teams that still rely on call based outreach, external specialists such as cold callers for outbound programs can also be treated as a distinct source and measured with the same attribution discipline as digital channels.
6. Sales Accepted Lead (SAL) Rate
A high MQL count does not prove demand. SAL rate is the first place sales can reject that story.
The formula is sales accepted leads divided by marketing qualified leads in the same period. Use a fixed acceptance window, such as seven or fourteen days, or the metric will drift with rep workload instead of lead quality.
SAL rate measures alignment at the handoff. It can prove that scoring rules, targeting, and sales criteria are close enough to produce workable conversations. It can also hide execution problems after review. A rep may accept leads out of habit, or reject them because follow-up capacity is tight, not because the underlying demand is weak.
Recent benchmark coverage from Advantir reports average sales accepted lead rates of 26 percent in B2B SaaS and median MQL to SQL conversion of 13 percent. Use figures like that as range checks, not targets. SAL rate depends heavily on how the company defines MQL, how quickly sales reviews it, and whether inbound, outbound, and partner leads are mixed into one denominator.
The useful analysis starts with cuts, not averages. Compare SAL rate by source, persona, account tier, geography, rep team, and qualification rule version. Then review rejection reasons in parallel. "Wrong company size," "student or competitor," "no active initiative," and "already in open opportunity" point to different fixes. One calls for tighter targeting. Another points to duplicate routing or account-level visibility gaps.
A common pattern is rising MQL volume with flat or falling SAL rate. That usually means one of three things. Marketing widened the gate faster than sales agreed to it. Sales capacity changed and review standards tightened. Or engagement signals are being mistaken for buying intent.
Yalc can support the operating workflow by logging qualification evidence at handoff, syncing acceptance status from CRM, and preserving rejection reasons in a consistent format. That makes SAL rate more than a scorecard. It becomes a diagnostic layer for revising scoring rules, routing logic, and account suppression before low quality volume turns into pipeline noise.
7. Lead to Opportunity Rate
Profile fit meets real commercial intent. The formula is accepted leads that become opportunities divided by total accepted leads in the period. The company should define opportunity tightly and enforce that definition in CRM. If one team counts any booked meeting while another requires a confirmed discovery with need and next step, the KPI becomes political noise.
Lead to opportunity rate matters because it tests whether accepted leads are worth pursuit. Many teams stop measurement too early and assume accepted means promising. It often doesn't.
What this KPI reveals that SAL cannot
Recent benchmark style coverage argues that better lead generation measurement should focus on how quickly qualified buying activity becomes pipeline, with operators watching SQL to opportunity rate and pipeline velocity rather than raw lead counts in this benchmark discussion of pipeline oriented metrics. That is the right frame. SAL shows agreement. Opportunity creation shows commercial traction.
This KPI can prove whether a source produces actual buying conversations. It can hide rep execution issues if one team qualifies sharply and another does not.
Practical comparisons
Compare lead to opportunity rate by source, rep, account segment, and message path. A website hand raiser should not be benchmarked against fully cold outbound in the same way. The intent profile is different, so the expected opportunity rate is different too.
Use simple diagnostic questions when the rate falls:
- Check source mix: Did a lower intent source make up more of the accepted leads this period.
- Check rep handling: Are reps applying the same qualification standard and next step discipline.
- Check opportunity definition: Did anyone loosen stage entry to make pipeline look healthier than it is.
Yalc can automate parts of the qualification conversation, route replies, log stage progression, and let operators compare which playbooks create real opportunities rather than just booked meetings. That matters because pipeline quality depends as much on consistent qualification as on lead volume.
8. Lead Velocity Rate (LVR)
More leads do not prove growth. Consistent growth in qualified leads can indicate future pipeline expansion, but only if the qualification rule stays stable.
LVR measures the rate of change in qualified lead volume over time, usually month over month:
LVR = (Qualified leads this period - Qualified leads last period) / Qualified leads last period × 100
That formula matters because LVR is a momentum KPI, not a quality KPI. It can prove whether top-of-funnel and mid-funnel programs are creating more qualified demand than they did in the prior period. It can also hide a looser scoring model, a temporary spike from one campaign, or a shift toward lower-fit segments that sales will not convert later.
What LVR can confirm, and what it can distort
Research from HubSpot's sales pipeline reporting frames pipeline health around trend lines and stage movement rather than raw lead totals, which is the right way to read LVR in practice: as a directional signal, not a standalone verdict on performance (https://blog.hubspot.com/sales/sales-pipeline-metrics).
A rising LVR can support three useful conclusions. Demand creation is increasing. Outreach capacity may need to expand. Future SQL and opportunity volume may improve if downstream conversion rates hold.
A rising LVR can also mask problems. If MQL criteria changed last month, the metric is inflated. If growth came from one low-intent source, pipeline creation may stall two stages later. If one segment grows while another contracts, aggregate LVR can look healthy while core ICP coverage weakens.
How to calculate and compare it
Calculate LVR on one qualified stage only. For example, use MQLs if marketing owns qualification, or SQLs if sales qualification is the cleaner control point. Mixing stages makes trend comparisons noisy.
Then compare LVR across these cuts:
- Source: paid search, outbound, organic, partner, events
- Qualification tier: ICP fit bands, score ranges, or persona groups
- Account segment: SMB, mid-market, enterprise
- Time cohort: week over week for fast feedback, month over month for planning
Those comparisons answer a more useful question than "Are leads growing?" They show where qualified demand is accelerating, and whether that acceleration matches the parts of the market the business wants.
Diagnostic actions when LVR rises or falls
If LVR increases, verify three things before treating it as progress:
- Qualification consistency: Were scoring thresholds, routing rules, or stage definitions changed?
- Downstream retention: Are those new qualified leads still becoming SALs and opportunities at expected rates?
- Source concentration: Is one campaign creating most of the growth, and is that growth repeatable?
If LVR drops, do the reverse. Check whether volume fell evenly across channels, whether a high-performing segment slowed, or whether response and follow-up discipline slipped enough to suppress qualification counts.
LVR becomes operational rather than cosmetic. The metric is useful because it prompts an intervention.
Yalc can support that workflow by applying the same qualification logic across campaigns, logging stage progression by segment, and flagging when lead growth is coming from plays that do not hold their value downstream. That helps operators separate real momentum from faster lead accumulation.
8-Point Lead Generation KPI Comparison
| Metric | 🔄 Implementation Complexity | ⚡ Resource Requirements | ⭐ Expected Effectiveness | 📊 Expected Outcomes | 💡 Ideal Use Cases / Key Advantages |
|---|---|---|---|---|---|
| Cost Per Lead (CPL) | Medium, simple formula but needs consolidated spend tracking across channels | Medium, ad spend, attribution tags, finance & CRM inputs | ⭐⭐⭐, effective for cost control but blind to lead quality | Predictable budgeting; highlights high-cost channels | Budget allocation, early forecasting; pair with quality metrics |
| Conversion Rate (Lead → MQL/SQL) | Medium, requires clear ICP and consistent qualification rules | Medium, CRM tracking, source tagging, sales alignment | ⭐⭐⭐⭐, strong indicator of lead relevance and ICP fit | Reveals funnel bottlenecks; guides channel investment | Target refinement, channel prioritization, qualification improvements |
| Lead Response Time | Medium, requires automation/routing or staffed coverage to meet SLAs | Medium, automation tools or staffing for fast SLAs | ⭐⭐⭐⭐, high impact on conversion and deal velocity | Faster conversion, reduced lead decay, shorter sales cycles | Inbound/demo handling and high-intent leads; set SLAs & automate first touch |
| Lead Quality Score (LQS) | High, builds rule-based or ML models and ongoing tuning | High, rich data, modeling, maintenance and tooling | ⭐⭐⭐⭐⭐, highly predictive for prioritization when trained well | Better prioritization, improved rep productivity, higher conversion | High-volume pipelines, ABM, routing to appropriate reps; audit regularly |
| Lead Source Attribution | High, multi-touch models require integrations and clean data | Medium–High, tagging, integrations, analytics stack | ⭐⭐⭐⭐, essential for accurate channel performance insights | True CPL by source; reveals hidden high-performers and journeys | Channel mix optimization, campaign ROI, multi-touch journey analysis |
| Sales Accepted Lead (SAL) Rate | Medium, depends on agreed criteria and sales discipline | Low–Medium, CRM fields and regular SLA/process reviews | ⭐⭐⭐, reveals alignment issues; sensitive to subjectivity | Signals misalignment or capacity constraints; improves targeting when reconciled | Align marketing & sales, diagnose capacity vs. quality; document acceptance criteria |
| Lead → Opportunity Rate | Medium, needs consistent opportunity definition and tracking | Medium, CRM stage hygiene and rep adherence | ⭐⭐⭐⭐, measures real engagement and sales execution quality | Direct pipeline impact; improves forecasting and coaching focus | Forecasting, rep coaching, qualification audits |
| Lead Velocity Rate (LVR) | Low, simple calc but needs reliable, segmented lead counts | Low, reporting dashboards and segmentation | ⭐⭐⭐⭐, strong leading indicator of momentum (quality dependent) | Early warning on growth trends; projects future pipeline | Scaling GTM, monitoring growth momentum; segment by quality to avoid false positives |
Turn Eight KPIs Into One Operating Rhythm
These metrics work when leaders review them in groups, not one by one.
Review CPL and attribution when allocating budget. Those two metrics answer where money is being spent and which sources deserve more of it. If cost is rising in one channel while another source consistently produces stronger accepted leads, the decision is operational, not philosophical.
Review conversion rate, lead quality score, and SAL rate when diagnosing fit and alignment. Those three show whether the team is attracting the right accounts, applying the right qualification rules, and handing sales leads it will pursue. When one of them weakens, the fix usually sits in targeting, routing, scoring, or sales and marketing definitions.
Review response time and lead to opportunity rate when improving execution. Response time shows whether the team is engaging at the right moment. Lead to opportunity rate shows whether those accepted leads are becoming real pipeline. Put together, they show whether the commercial motion is disciplined after capture.
Keep LVR for forecasting and early warning. It is the momentum view, not the root cause view. If LVR drops, the next step is not to demand more leads. The next step is to inspect which upstream metric broke first.
One metric should lead to one action. If it doesn't change a decision, it doesn't belong in the operating review.
A workable cadence is simple. Use one shared metric dictionary. Track source and stage at capture, not after the fact. Set explicit thresholds for each KPI. Review changes weekly, with monthly pattern reviews for deeper funnel stages. Not every team needs a bigger dashboard. They need cleaner definitions and more disciplined intervention.
Yalc can fit into that system as one operational layer for unified source data, lead scoring, follow up execution, campaign reporting, and approval logging. That doesn't remove operator control. Teams still define the ICP, own the thresholds, decide which actions need approval, and decide when a play deserves more investment.
The practical sequence is straightforward. Fix definitions first. Establish a baseline second. Pick one bottleneck instead of chasing every metric at once. Automate the repeatable work around that bottleneck. Then review the verdict before scaling the play. That is how lead generation KPIs stop being reporting artifacts and start becoming a management system.
Yalc gives GTM teams one place to run and measure the work behind these KPIs, from sourcing and scoring to follow up, CRM sync, and campaign reporting. It can help teams connect source data, qualification logic, and execution logs so the numbers are easier to trust and act on. See how it works at Yalc.