Software Sales Performance Management That Works

The quarter closes below target, but the sales dashboard still looks busy. Reps logged outreach, managers reviewed pipeline, and the forecast stayed optimistic until deals slipped. Leadership wants accountability, yet nobody can tell whether sellers executed poorly or the operating plan gave them too little chance to succeed.
Software sales performance management should resolve that uncertainty before leaders change headcount, compensation, or tools. A trustworthy system connects targets to evidence, turns diagnosis into a specific action, and checks whether that action produced better commercial results.
Table of Contents
- Why Sales Performance Breaks
- What Software Sales Performance Management Means
- Core Metrics for Sales Performance
- Tooling and Architecture for Performance Data
- Governance for Fair Automated Scoring
- A Scenario for Diagnosing Performance
- Implementation and Continuous Improvement
- A Practical Evaluation Checklist
Why Sales Performance Breaks
A missed quota is an outcome, not a diagnosis. The same result can reflect weak discovery, inadequate opportunity coverage, unrealistic targets, poor routing, insufficient onboarding, or incomplete CRM records. Ranking sellers before separating those causes creates false precision.
The operating challenge is substantial. RepVue's second quarter 2025 Cloud Sales Index covered approximately 47,000 ratings across 246 cloud and software companies and reported 42.69% quota attainment, according to the analysis of RepVue's cloud sales findings. That figure establishes context, but it doesn't explain why any particular seller missed.
Inspect the conditions before judging execution
Managers should establish what each seller had available and what happened after an opportunity entered the pipeline.
- Opportunity access: Review account quality, qualified demand, routing decisions, and territory coverage.
- Readiness: Check tenure, onboarding completion, product knowledge, and access to specialist support.
- Execution evidence: Inspect discovery, stakeholder engagement, agreed next steps, and progression against qualification criteria.
- Record reliability: Verify that stages, close dates, amounts, and ownership reflect actual deal conditions.
These checks prevent a common management error: prescribing coaching for a planning problem. A seller without enough viable accounts needs a different intervention from a seller who repeatedly loses suitable opportunities after discovery.
Stop treating activity as proof
More calls, higher CRM usage, and a larger pipeline can accompany stronger execution. They aren't sufficient evidence of it. Managers should ask whether those activities produced qualified conversations, credible opportunities, and commercially sound wins.
A pipeline total also needs interpretation. An attractive amount attached to stale or poorly qualified records shouldn't count as healthy coverage.
The management sequence should be conditions, behavior, then outcomes. Leaders can still hold sellers accountable, but they should identify the failure mechanism before assigning responsibility or changing incentives.
What Software Sales Performance Management Means
Software sales performance management is the operating practice of setting targets, observing execution, evaluating outcomes, coaching behavior, allocating resources, and learning from results. It joins management decisions to the evidence needed to defend them.
It runs as a closed evidence loop. Planning establishes assumptions. Execution generates observations. Reviews compare those observations against expected results. Managers act, and later outcomes show whether the original assumptions deserved to survive.
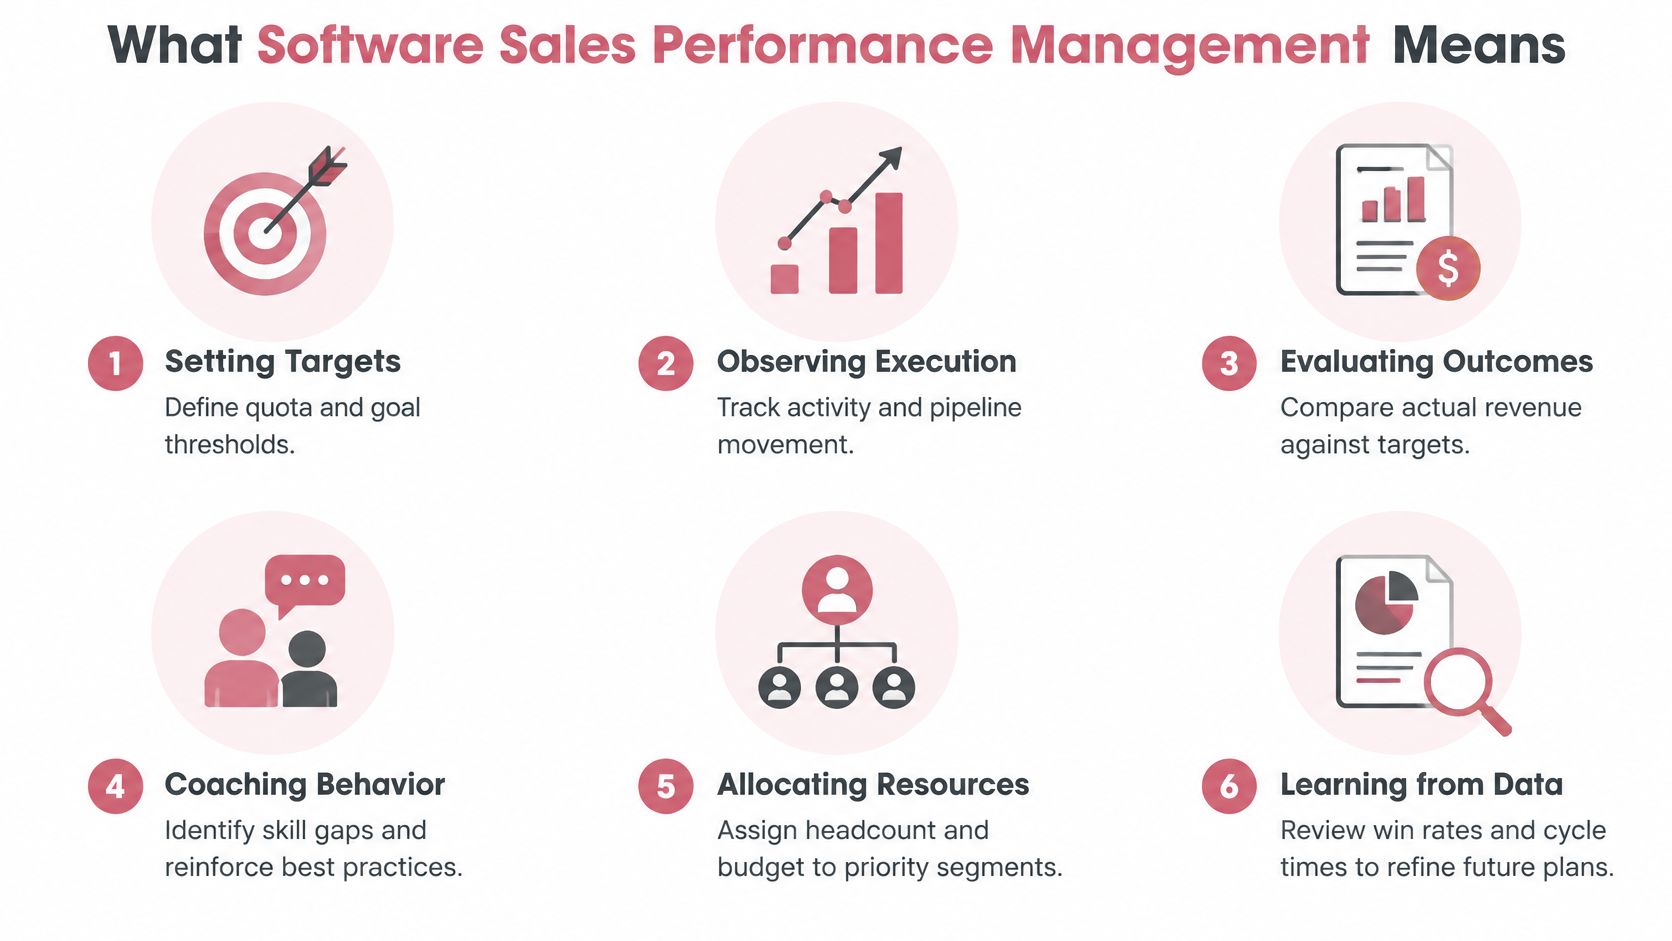
A leaderboard ranks sellers. This loop explains them. Each stage feeds a distinct decision and leaves a record a leader can review later:
| Loop stage | Decision it supports | Evidence worth keeping |
|---|---|---|
| Setting targets | What a territory can reasonably produce | Seller capacity, ramp status, demand, territory history |
| Observing execution | Whether opportunities advance through defined milestones | Stage progression, stakeholder engagement, agreed next steps |
| Evaluating outcomes | Whether results match plan assumptions | Commercial results weighed against the plan's rationale |
| Coaching behavior | Which skill or decision to improve | Call evidence, discovery notes, qualification gaps |
| Allocating resources | Where support and coverage should move | Demonstrated constraints by segment or territory |
| Learning from results | Which planning assumptions to change | Outcomes tied to the intervention that produced them |
The value sits in the connections, not the presentation. A forecast adjustment should trace back to deal evidence. A coaching action should name the behavior it targets. A territory change should carry its planning rationale forward, so the next planning cycle can judge it fairly.
For a companion method on monitoring execution, Grou's guidance can help leaders spot sales drift early and decide which deviations warrant inspection.
Keep incentives inside the operating loop
Compensation shouldn't run as a separate accounting exercise. Leaders decide which commercial outcomes deserve credit and how payout mechanics reinforce them.
Forrester's compensation mechanics guidance describes threshold, target, and excellence milestones, with accelerators and decelerators changing payout rates around them. Operators should document crediting, splits, cancellations, caps, and payment timing before applying those mechanics.
Operating principle: Every performance signal should support a decision, and every decision should leave evidence that can be reviewed later.
The output is a management system that explains why leaders made a decision and whether the evidence supports making it again.
Core Metrics for Sales Performance
Measure attainment alongside the drivers that make attainment possible. A revenue result without context encourages shallow conclusions. A collection of activity metrics without a commercial outcome encourages busywork.
Quota attainment measures credited performance against the assigned target. Leaders should inspect its distribution across sellers, not just the team average, and separate established sellers from those still ramping.
Benchmark definitions matter. A 2025 compensation benchmark reported 74% average quota attainment, while technology seller benchmarks use different populations and measurement approaches, as discussed in the CaptivateIQ sales compensation benchmark report. Leaders shouldn't treat average quota attainment and the share of sellers reaching quota as interchangeable measures.
Read velocity through its components
Pipeline velocity combines qualified opportunity count, average deal value, win rate, and sales cycle duration. Conceptually, teams multiply the opportunity count by deal value and win rate, then divide by cycle duration.
The composite helps summarize expected revenue production over time. Its components explain what management should do. Fewer qualified opportunities suggest a coverage problem; weaker win rates suggest a need to inspect targeting, qualification, or execution.
Cycle time should use a consistent starting event. Conversion rates need explicit entry and exit criteria. Otherwise, a process change can appear to improve performance merely because the denominator changed.
Performance metric diagnostic map
| Observed signal | Core metric | Diagnostic question |
|---|---|---|
| Sellers miss despite substantial activity | Quota attainment | Was sufficient attainable opportunity available? |
| Pipeline looks large but produces little revenue | Pipeline velocity | Which component deteriorated? |
| Deals repeatedly fail after discovery | Stage conversion | Did buyers meet qualification requirements? |
| Opportunities remain open without progress | Cycle time and stage age | Which buying milestone remains unresolved? |
| Revenue repeatedly differs from expectations | Forecast error and bias | Were assumptions wrong or records unreliable? |
| New sellers struggle to contribute | Ramp time | Was readiness defined and supported? |
| Bookings rise but economics weaken | Revenue quality | Did discounting or delivery obligations undermine value? |
Define the commercial guardrails
Forecast accuracy should compare a preserved forecast with the eventual result using a consistent error measure. Bias should show whether leaders systematically overestimate or underestimate outcomes.
Ramp time needs an agreed endpoint, such as sustained performance against the company's readiness standard. Revenue quality should reflect the economics relevant to the business, including margin, discounting, payment terms, and cancellations.
A useful sales dashboard design puts these measures beside their diagnostic context. Managers should be able to move from an aggregate result to the affected segment and underlying records without reconstructing the calculation.
Tooling and Architecture for Performance Data
A scoring model built on unreliable records will flag the wrong sellers with impressive confidence. Before any automated score goes live, the data underneath it needs a traceable path: where each value originated, when the system received it, and which rules changed it along the way.
Validity's research found that nearly three quarters of organizations with good to very good CRM data reported accurate or very accurate forecasts, compared with slightly more than one third of organizations with poor quality data in its CRM data management research. That evidence puts CRM completeness alongside uptime and latency in the technical specification, rather than among cosmetic adoption metrics.
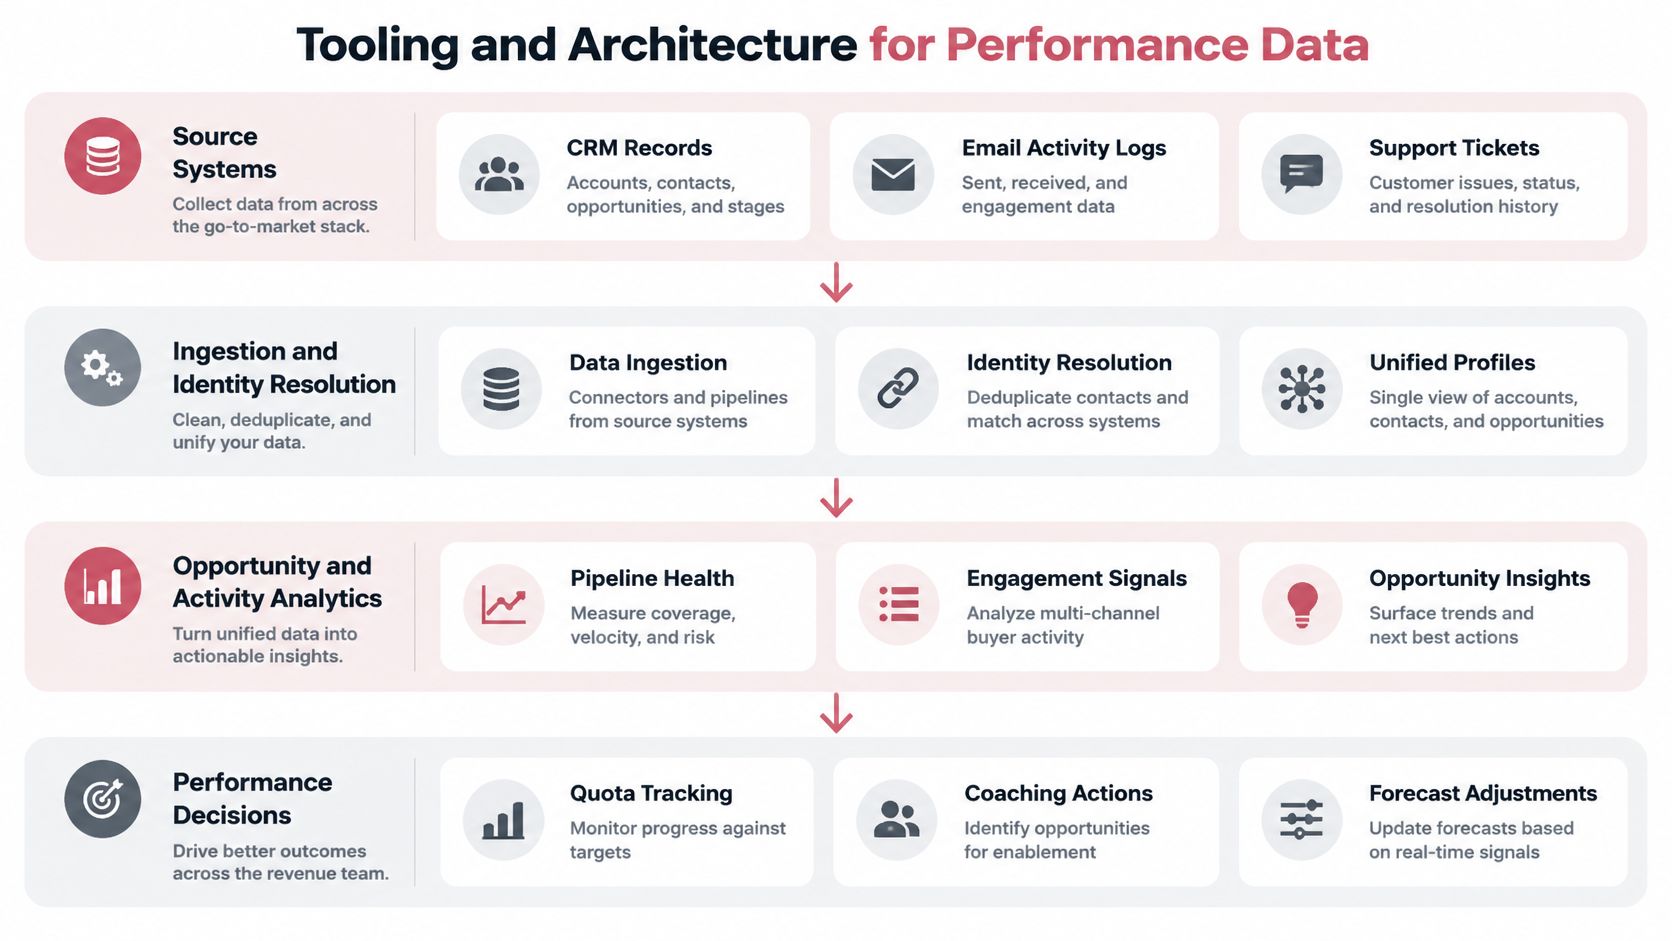
The architecture has four jobs, and each one maps to a distinct control:
| Layer | Required control |
|---|---|
| Source and ingestion | Ownership, freshness checks, and failure visibility |
| Identity and history | Reconciliation rules and recoverable changes |
| Metrics and scoring | Documented definitions and version history |
| Decisions and actions | Named owners, acknowledgments, and audit records |
At the record level, four rules do most of the work. Timestamp both when an event occurred and when the system received it. Reconcile contacts, companies, sellers, and opportunities without merging unrelated records. Store stage transitions, amount revisions, ownership changes, and close date movement so history can be replayed. Apply field requirements at the lifecycle stage where the information should reasonably exist. When a value is missing, leave it visibly missing; an inferred value must carry its origin and confidence rather than presenting itself as observed fact.
Keep connectors out of the business logic
A unified GTM API or comparable integration layer can connect CRM, warehouse, enrichment, outreach, chat, and reporting tools. Vendor specific connectors belong outside the definitions that determine attainment, conversion, and scoring. That boundary matters most during vendor changes: replacing an enrichment provider should never require rewriting what a qualified opportunity means.
The calculation layer publishes versioned metric definitions. A scoring service consumes them, dashboards distribute the results, and every output points back to contributing records. Leaders evaluating sales reporting tools should require that drill-down access rather than polished summaries alone.
An alert earns its place only when it carries a reason, supporting evidence, and a responsible person. Notifications without those three things create activity, and accountability stays missing.
Governance for Fair Automated Scoring
An automated score should explain a concern, not pronounce a verdict. Leaders should reject any ranking that can't distinguish seller decisions from account allocation, territory conditions, or missing data.
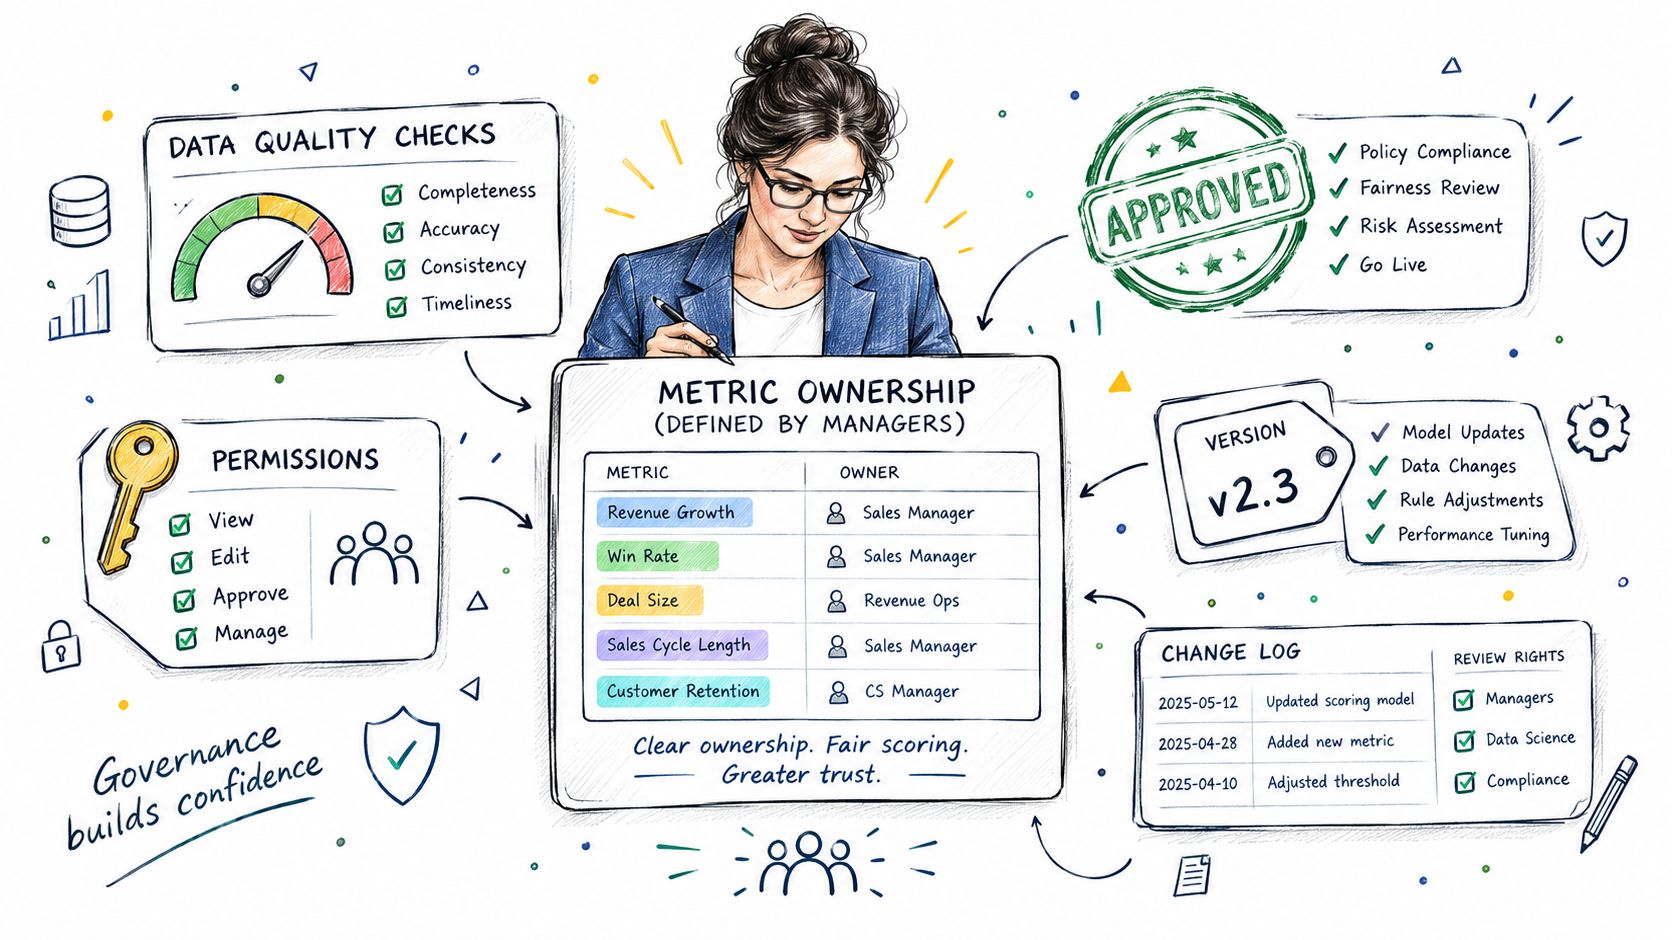
Governance starts with ownership. Revenue operations should maintain definitions and lineage, sales leaders should own coaching decisions, and finance should approve compensation related calculations. A named owner should resolve disagreements about each metric.
Keep judgment separate from observation
Rep submitted confidence is useful information, but it isn't the same as recorded buyer behavior. Store seller judgment separately from activity history, stakeholder coverage, historical outcomes, and contextual variables.
Forecast disagreement illustrates why. Xactly's survey of 405 sales and finance professionals found that four in five respondents reported a missed quarterly forecast during the previous year, according to its forecasting collaboration research. Operators should preserve the original submission, subsequent adjustments, adjustment owners, and the evidence behind each change.
A score without a visible reason is unsuitable for a consequential personnel or compensation decision.
Make review rights operational
Governance needs working controls, not a policy document that nobody consults.
- Explainability: Show the inputs, missing values, rule version, and reason for each material score.
- Permissions: Limit access to the records and actions each role requires.
- Approval gates: Pause sensitive outreach, account reassignment, and compensation adjustments for authorized review.
- Change control: Record who changed a rule, why it changed, and when it became effective.
- Review rights: Let sellers challenge incorrect evidence and receive a documented resolution.
Managers should also inspect whether scoring rewards volume at the expense of relevance. An outreach count shouldn't offset poor qualification or unresolved customer objections.
Historical results must retain the rules that produced them. Applying a new scoring model to old decisions destroys the ability to explain what leaders knew at the time. Fairness requires both understandable inputs and a recoverable decision history.
A Scenario for Diagnosing Performance
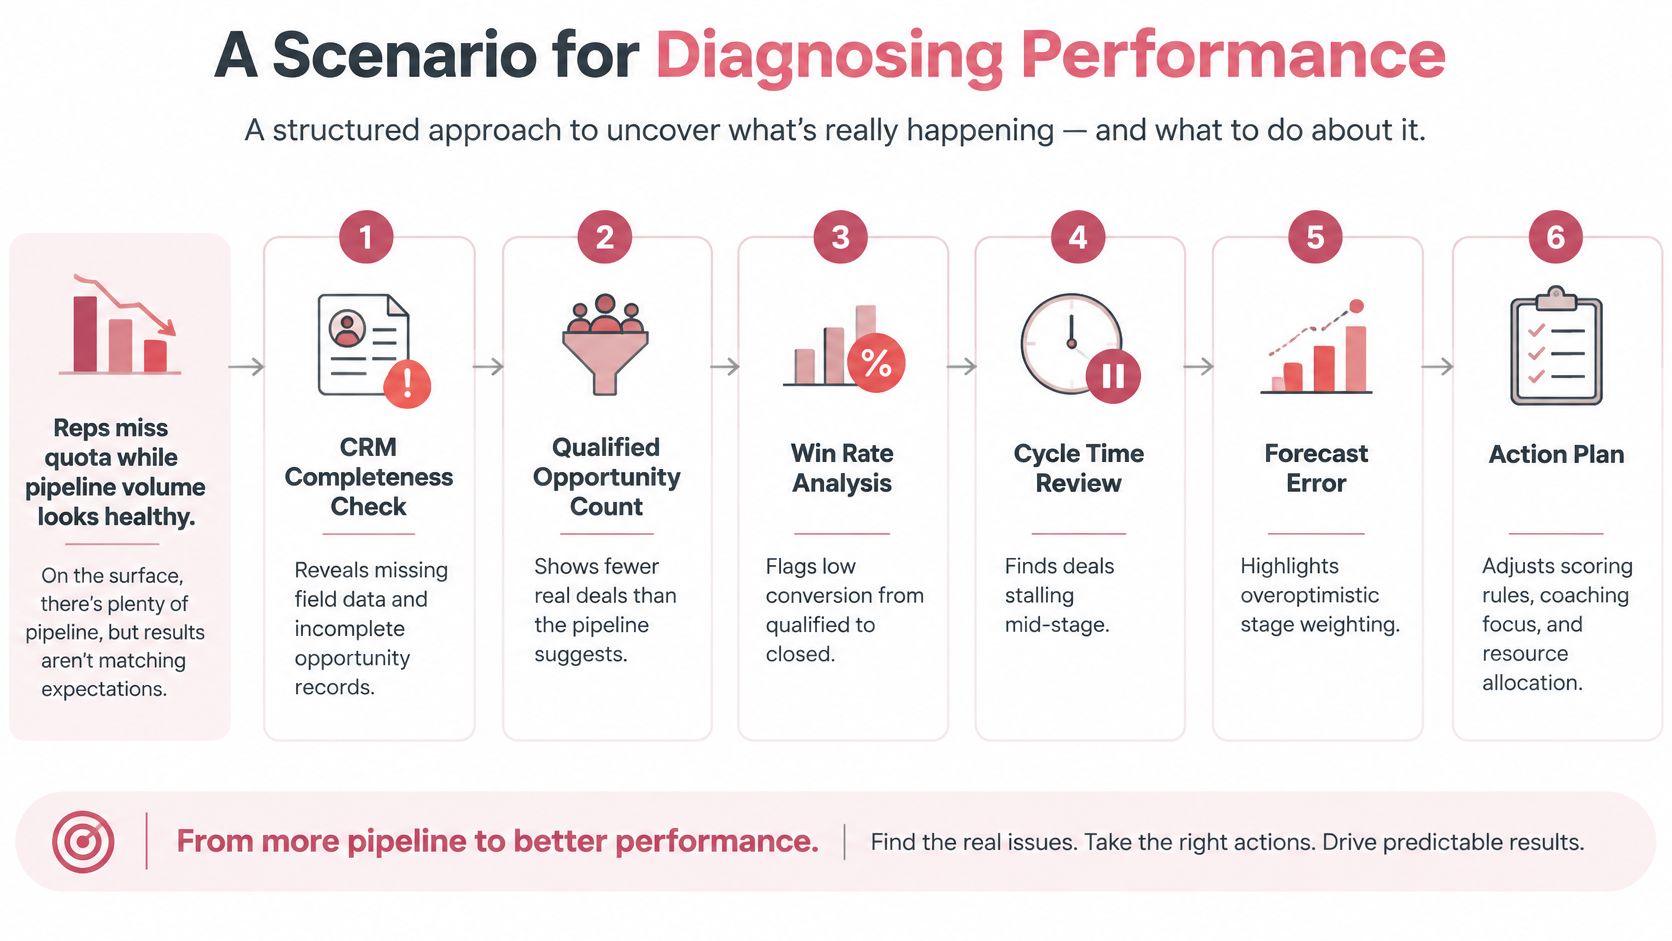
A useful diagnosis ends with different actions for different causes. Consider a hypothetical software team whose sellers miss quota while reported pipeline remains substantial. The following scenario illustrates a review method, not a documented customer result.
The manager initially suspects weak closing skills. Revenue operations postpones that conclusion until the team examines the opportunity records and comparable seller cohorts.
Reconstruct the actual selling situation
The analyst checks missing fields and discovers that some opportunities lack current close dates or documented buying requirements. Those records remain visible, but managers separate them from verified coverage.
Next, the team reviews qualified opportunity count, win rate, and cycle time by segment, tenure, and territory. This avoids comparing a newly assigned seller in an undeveloped territory with an established seller working mature accounts.
The manager then inspects the evidence behind stalled opportunities. The intervention depends on what that inspection reveals.
| Hypothetical finding | Appropriate response |
|---|---|
| Accounts don't match the intended customer profile | Revise targeting and routing |
| Suitable buyers enter discovery without clear requirements | Coach discovery and enforce qualification criteria |
| Recorded stages conflict with buyer commitments | Correct stage rules and inspect supporting evidence |
| Opportunity supply can't support the assigned target | Revisit territory capacity and quota assumptions |
| New sellers lack readiness for complex evaluations | Adjust onboarding and specialist support |
Assign an action that can be checked
For a discovery problem, the manager reviews calls, identifies the missing behavior, and documents the expected improvement. For a targeting problem, operations changes the relevant account selection rule instead of sending the seller to closing training.
The forecast owner separately inspects forecast error and stage weighting. Cleaning records shouldn't be presented as proof that sellers became more effective.
A published observational comparison reported 87% forecast accuracy for teams tracking pipeline velocity weekly, versus 52% for teams tracking it occasionally, as described in the pipeline velocity and forecasting analysis. That association supports testing a disciplined cadence, not promising the same result.
The team closes each review with an owner, a documented intervention, and an outcome to inspect later. If the evidence remains incomplete, the manager records the uncertainty rather than forcing a seller performance verdict.
Implementation and Continuous Improvement
A rollout fails when leaders change five things and then argue about which one mattered. Start with one motion that can be inspected end to end: lead routing, discovery qualification, forecast submission, or onboarding readiness. Freeze the definitions before touching execution, including qualification, revenue credit, forecast submission, and ramp completion, so the baseline does not move while the team is being measured.
Revenue operations should own the rollout, with sales and finance agreeing on decision rights. A clear sales operations remit keeps metric maintenance, coaching accountability, and system administration from becoming unowned work. Managers keep accountability for seller behavior. Operations keeps accountability for rules, fields, and audit trails.
The first review should be boring on purpose. Preserve enough history to separate normal variation from a real break, then inspect material deviations by segment before proposing broad fixes. Pick a bounded intervention, such as a targeting rule, a discovery behavior, or a sequencing change, and write down the expected mechanism before launch. If the mechanism cannot be stated, the change is not ready.
Make improvement falsifiable
Where practical, hold out a comparable group. When random allocation is not feasible, compare cohorts matched on segment, tenure, territory potential, and starting pipeline. Judge commercial outcomes ahead of activity speed: opportunity quality, downstream conversion, margin adjusted revenue, and enough follow through to observe wins and losses. Faster preparation can still produce worse conversations.
Store each verdict with the intervention, comparison method, limitations, and supporting records. Keep inconclusive results separate from validated gains, and retire plays that repeatedly miss their stated criteria. A historical analysis reports quota attainment falling from 63% in 2012 to 28% in 2024, while CRM and sales enablement spending grew approximately five to six times, according to the sales quota attainment analysis. The association does not prove causation; it does make tool adoption an unacceptable substitute for verified improvement.
A Practical Evaluation Checklist
A modern sales stack isn't proof of a sound performance system. Leaders should evaluate whether the system supports defensible decisions, fair accountability, and repeatable commercial results.
Require evidence before expanding the rollout
The evaluation should use actual records and completed decisions, not just a demonstration dashboard.
- Quota realism: Can leaders explain the capacity and opportunity assumptions behind each target?
- Input reliability: Are required CRM fields complete, current, and traceable to their origin?
- Diagnostic visibility: Can managers inspect the individual velocity drivers rather than a pipeline total?
- Fair comparison: Are seller controllables separated from tenure, territory, and market effects?
- Forecast accountability: Are original forecasts, adjustments, owners, and final outcomes preserved?
- Scoring transparency: Can a seller understand and challenge the evidence behind a score?
- Controlled action: Do sensitive changes require approval from an authorized person?
- Verified improvement: Was the intervention evaluated against a baseline and a credible comparison?
A failed check should produce a remediation owner and a clear acceptance condition. Buying another tool shouldn't be the default response to a missing operating discipline.
Judge the decision trail
The strongest evaluation follows a real issue from detection through diagnosis, intervention, and outcome review. Leaders should be able to explain why they acted, what alternatives they considered, and what evidence would cause them to reverse course.
Reward better decisions and repeatable revenue, not more dashboards or automated activity. Software sales performance management works when managers can defend both the result and the process used to reach it.
Yalc offers GTM automation through a unified API, playbooks with explicit success metrics, and recorded verdicts that feed outcomes into future execution. Teams evaluating a closed evidence loop can visit Yalc to explore how its audit logs, scoped permissions, and approval controls could fit their performance management process.